Spotify Statistics
Spotify Statistics
I wanted to enhance the listening experience on Spotify by adding a feature that allows users to explore their own listening statistics. Similar to the Spotify Wrapped experience but instead of solely annual data, once a year, you can access your data at any time, across any time. This feature enables users to learn about their personal music tastes, supporting Spotify’s overall mission of personal music discovery.
CLIENT
Course project
MY ROLE
Research
Product Design
DURATION
3 weeks
March 2024 - April 2024
THE TEAM
Just me!
Figma
TOOLS
THE PROBLEM…
Spotify listeners currently have no way to gain insight into their listening behaviors unless they wait for the annual Spotify Wrapped or download an entirely separate app.
THE GOAL…
Satisfy music listeners’ curiosities about their own music consumption by providing real-time statistical summaries of their streaming habits and favorites. This allows for deeper personal discovery, increased engagement with the platform, and increased visibility of the brand through content sharing options.
BENCHMARKING…
I started off my design process by looking into existing apps that provide listening statistics with either Spotify or Apple Music. Some of these platforms included Stats.fm, Spotilyze, Airbuds, Chosic, and Spotify’s very own annual Spotify Wrapped. Most of these apps displayed very similar types of content and measures of listening so this helped me understand the foundational content to be added in this feature.
INITIAL USER RESEARCH…
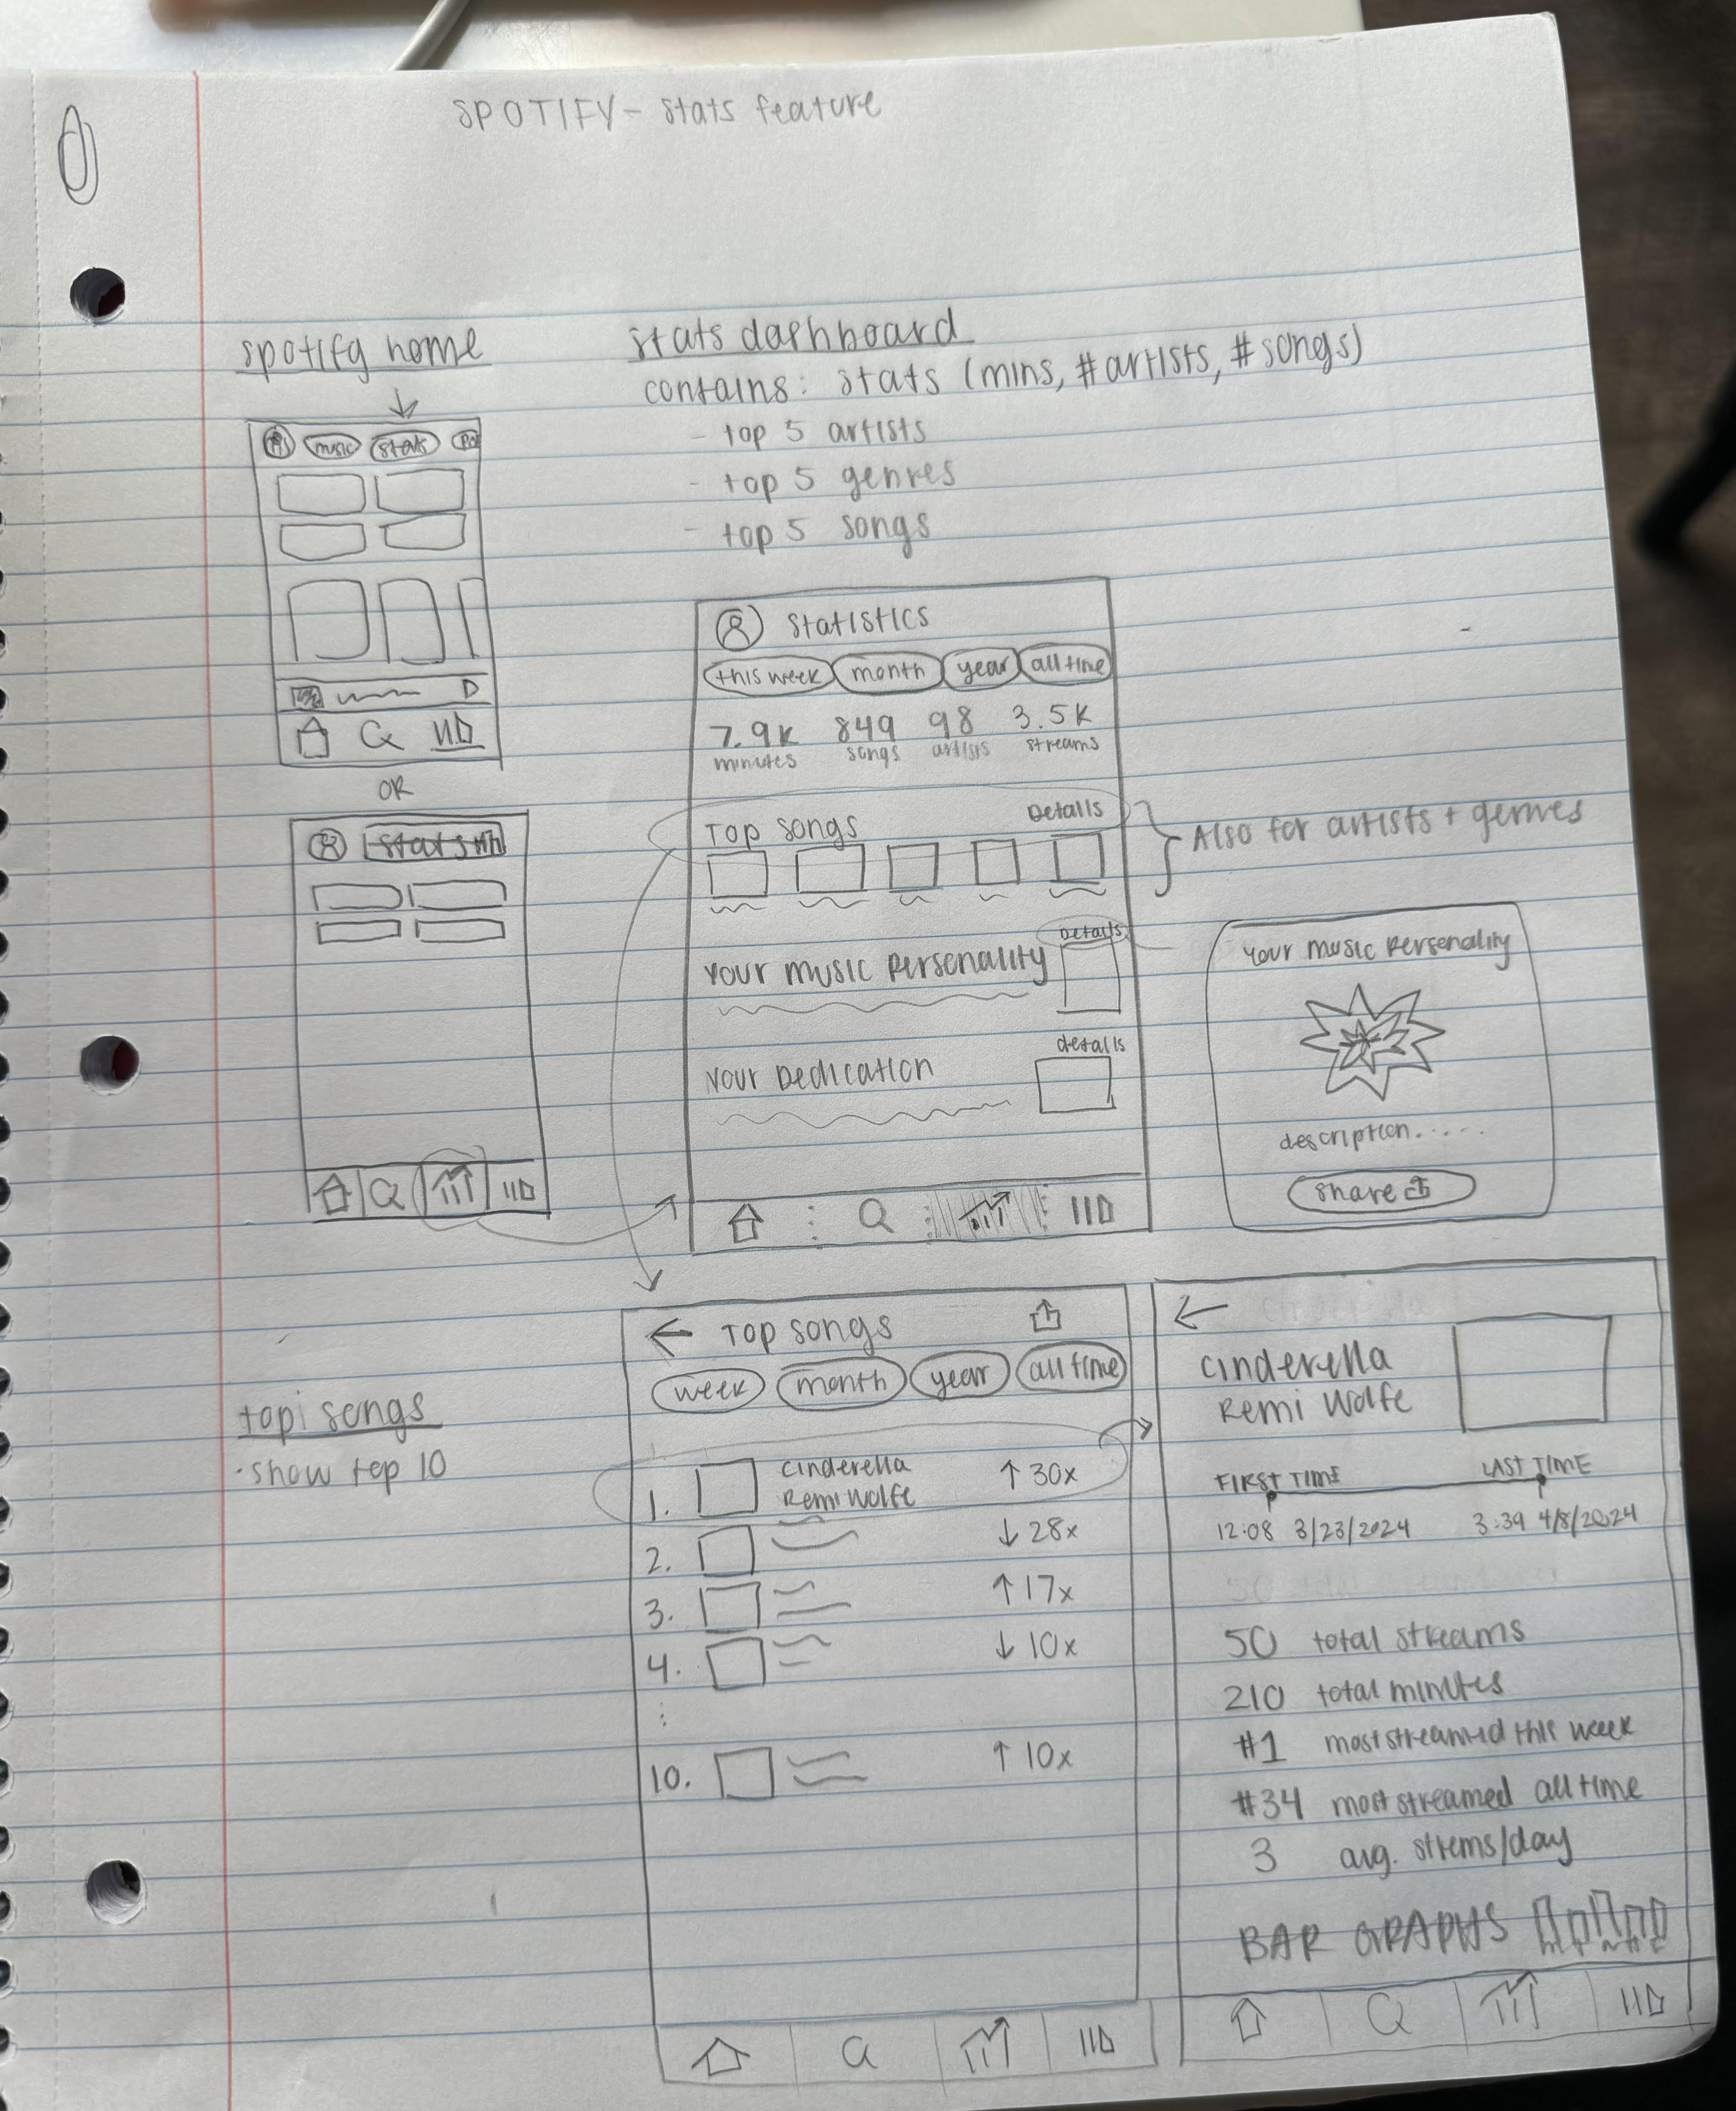
SKETCHING…
I wanted to hear from potential users about what they would want from this feature, to help inform my design process. Luckily, almost everyone listens to music so I was able to briefly interview five friends and peers about content they would want and how they want to see it. All five interviewees discussed how they enjoyed seeing their songs and artists ranked as well as what percentile of listening they were in for their favorite artists. One interviewee currently uses Stats.fm and enjoys looking at “all-time” data but would be more satisfied if they didn’t have to migrate to a separate app. All of this insight was taken into consideration as I began my sketching.
I wanted to transcribe my sketches into wireframes. I started out making very low-fidelity wireframes using Figma.
LOW-FIDELITY WIREFRAMES
HIGH-FIDELITY WIREFRAMES + PROTOTYPING…
I then enhanced my low-fidelity frames by taking it to high-fidelity level, following Spotify’s existing style guide. I wanted to make sure that this feature I am adding seamlessly blends in with the rest of the platform, adopting the same formats and aesthetic.
I added interactions to make this a clickable prototype. I began with the primary flow of selecting a song and seeing stats specifically for that song. Then I fleshed out alternative branching that users may follow to get to the same destination.
TAKEAWAYS…
This project helped me practice maintaining brand identity and allowed me to explore expressing a specific aesthetic, in this case the Spotify “dark and vibey” essence, manifested in different ways throughout the app. It was really fun coming up with a whole new architecture for something that doesn’t yet exist. It challenged me to be creative within set boundaries.


